
Texas Equine Industry Study 2015

Texas Equine Industry Study
How Horses Affect the Texas Economy
Beginning in the fall of 2015, the Texas Department of Agriculture supported a study conducted by the Texas A&M Equine Initiative and Texas A&M AgriLife Research to assess the economic impact of the Texas equine industry. This study was also supported by Mr. Bobby Cox and other industry leaders.
The purpose of the study was to gather information about respondents’ horses and facilities, demographics, participation in the industry, horse-related expenditures and economic impacts. Results of this study will be used by industry representatives, the Texas Department of Agriculture and other policy makers to respond to current needs of the state’s horse owners and related businesses.
Studies by other researchers in 1998 and 2005 found that Texas was home to more horses than any other U.S. state and that the horse industry was an important contributor to the state’s economy.
The current study reflects changes within the industry and the statewide economy over the past 10 to 20 years.
For detailed information, select a section:
Executive Summary
Texas ranked highest among all states in the U.S. in total number of horses in 2015.
In 2015, Texas was home to over 840,000 horses.
The total statewide economic output of the Texas equine industry is $5.9 billion.
The Texas equine industry contributes $3.3 billion to the Texas gross domestic product (GDP).
The Texas horse industry is responsible for $2.1 billion in Texas labor income.
Texas horses support 52,000 jobs statewide.
Recreational riding ownership leads the industry with $1.9 billion in revenues.
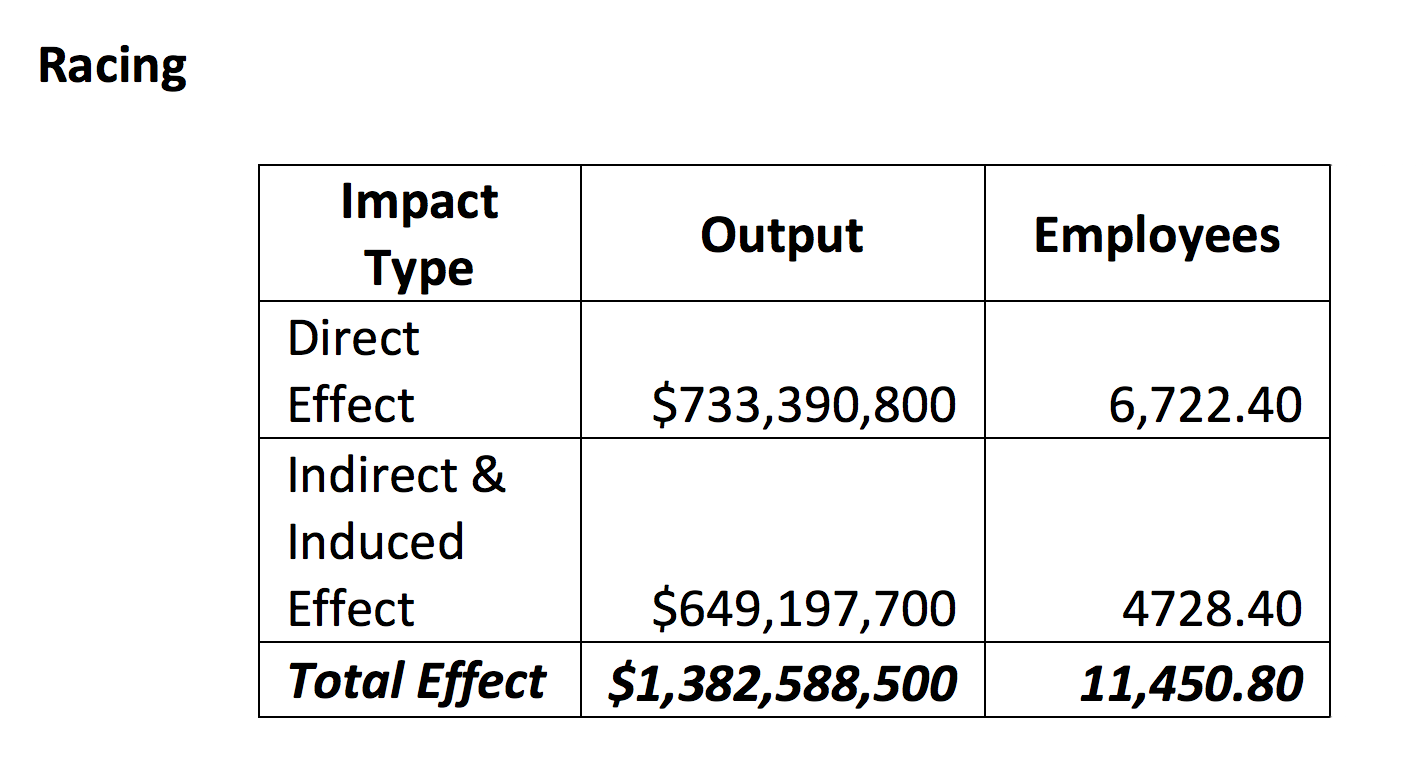
Horse racing contributed $733 million in business revenues in 2015.
Horse racing led to a total economic output of $1.4 billion and contributed $945 million to the Texas GDP.
Texas horse racing supported $689 million in labor income and 11,450 jobs in Texas in 2015.
Horses by the Numbers
While survey respondents indicated a very small (0.4%) decline in horse ownership between 2005 and 2015, a sample of breed association registries showed a larger decline of 13.6% on average.

Association memberships were down an even steeper 18.7%. Similarly, the U.S. Census of Agriculture recorded a 9.8% decline in horse inventories between 2007 and 2012, the latest available census.
Relatively steady horse ownership among survey respondents is likely a result of current horse owners being more likely to participate in the survey than former horse owners. It is also possible that extremely avid horse enthusiasts, who were unlikely to give up their horses, were more likely to respond.
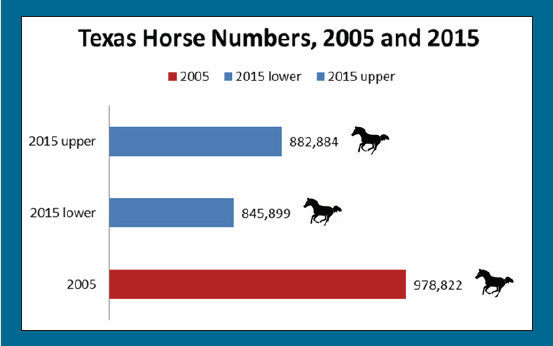
Deloitte estimated 2005 Texas horse numbers at 978,800. Using the average registry decline of 13.6%, the 2015 horse population was estimated at 845,900, a decline of 132,900 horses in a 10-year period. Using the smaller USDA contraction rate of 9.8%, the 2015 horse population could be estimated at 882,900, providing a population range (Figure 4).
Horse Ownership
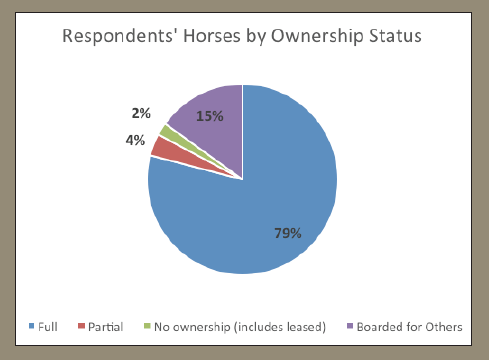
Most respondents had full ownership of their horses (79.1%) (Figure 5). Less than five percent (3.7%) of horses were products of partial ownership, and only 2.1% were not owned by the respondent (e.g., leased). Fifteen percent of horses were maintained/boarded for others.

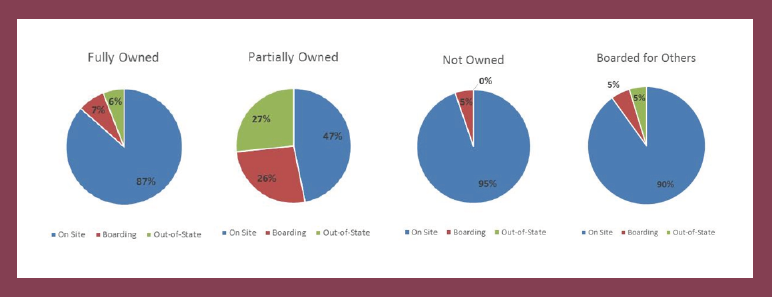
Among respondents, full ownership increased by 2.9% between 2005 and 2015 and partial ownership increased by 7.2%. The number of horses not owned by respondents or boarded for others decreased by 23.6% and 12.9%, respectively, over the same period. Partially owned horses were more likely to be located outside the state (Figure 6).

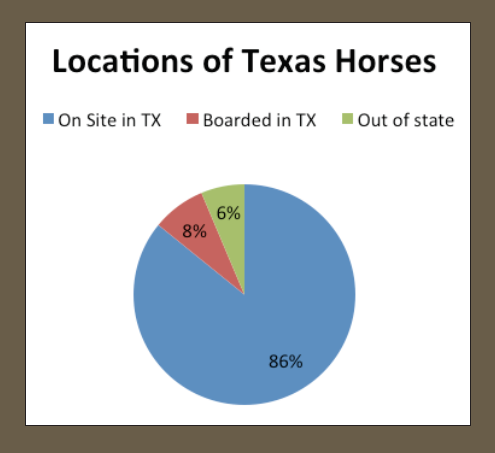
Locations of Texas Horses


Most of the survey respondents’ 15,137 horses (93.6%) were located in Texas (Figure 1). The vast majority were maintained/boarded at the respondents’ residences, farms, or other places of business, while 7.8% were boarded elsewhere within the state and 6.4% were lodged outside the state. Only 4.2% were boarded out of state in 2005.
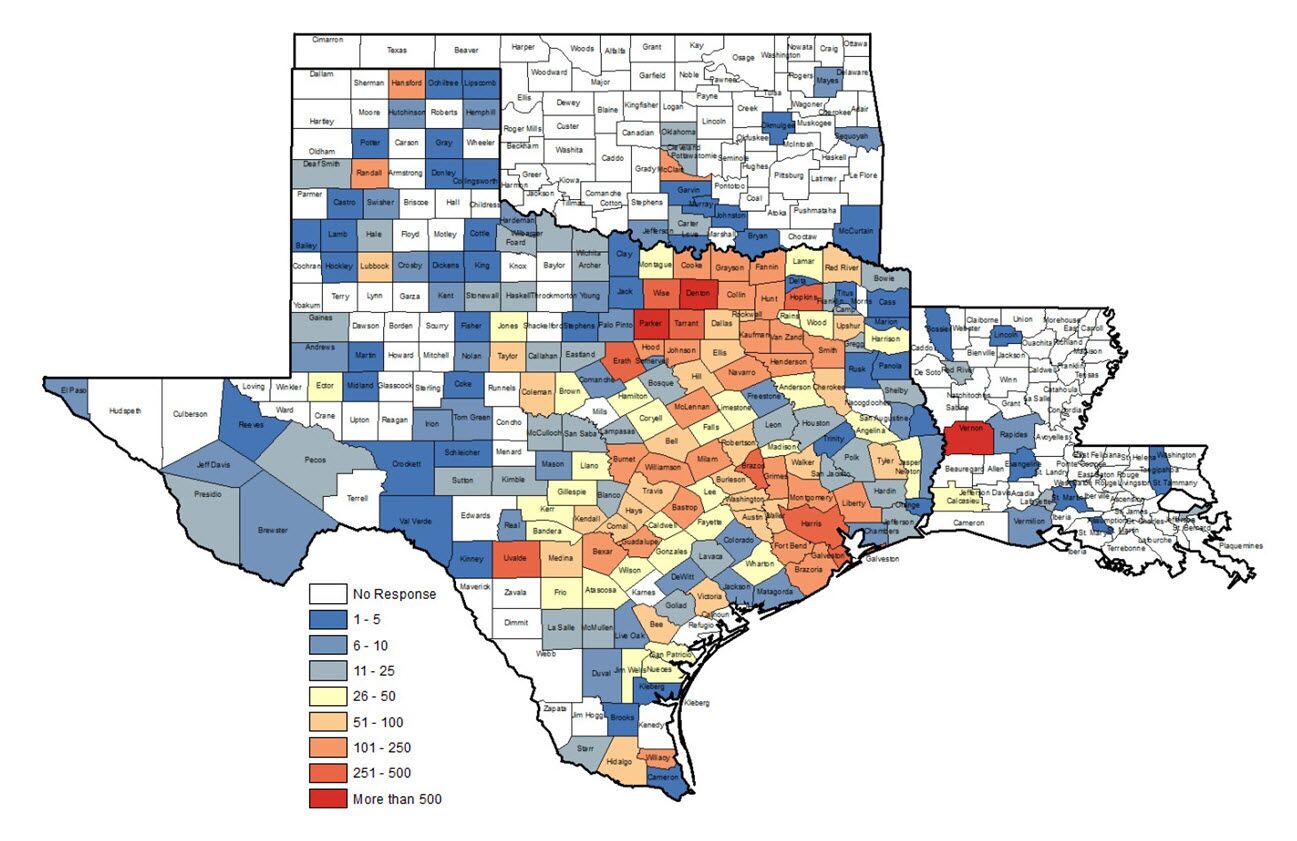
Most Texas horses maintained out of state are located in Louisiana and Oklahoma, but respondents’ horses also reside in several other U.S. states as well as the countries of Canada and Dubai. Figure 2 displays the distribution of respondents’ horses in Texas, Louisiana, and Oklahoma.

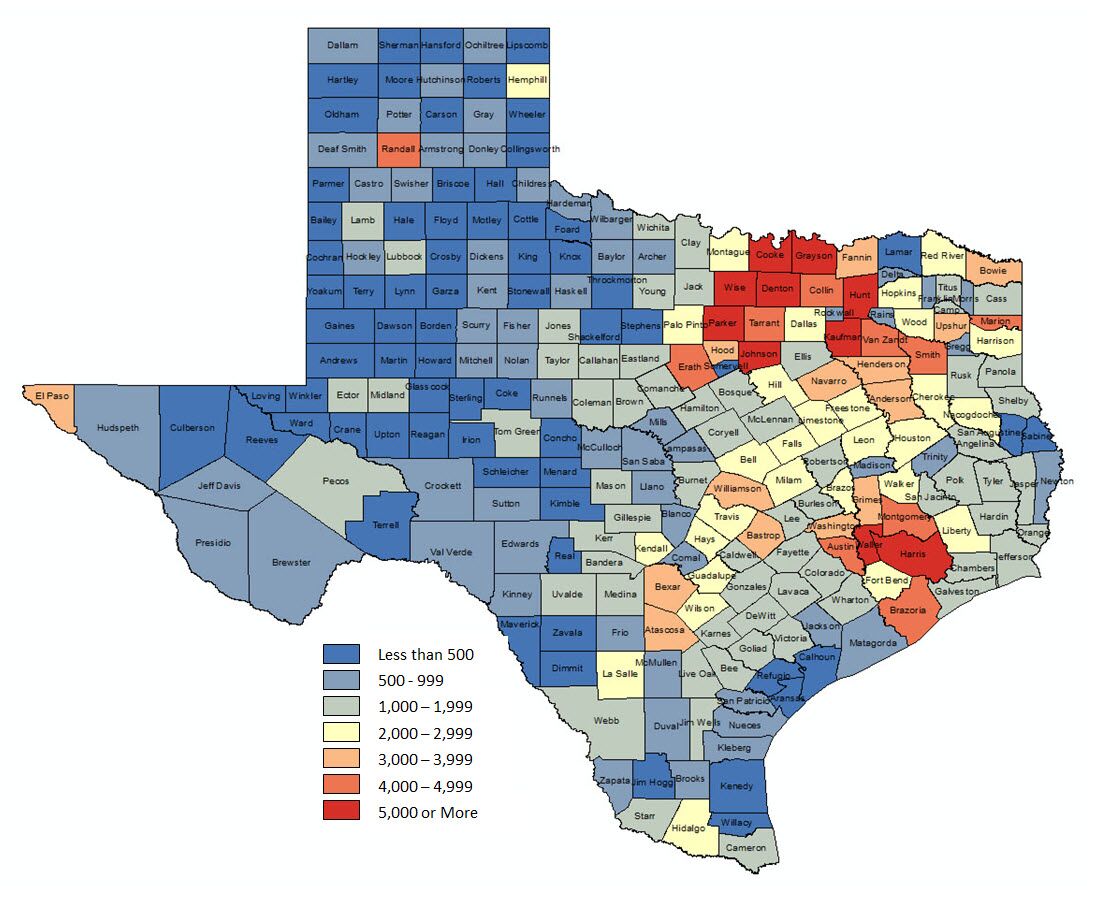
Respondents’ horses were most likely to be found within populated metropolitan corridors, and several counties had no survey respondents (Figure 2). The 2012 Census of Agriculture tabulated a somewhat different distribution of horses on Texas farms (Figure 3).
Only 396,000 horses are found on farms, but this metric does provide a different perspective on the Texas horse ownership and distribution, which is notably difficult to measure precisely because horses are owned by a wide array of businesses and there is no requirement to register horses with any entity in the state.

Youth Involvement


Only twenty-eight percent of respondents had at least one family member younger than age 18 who was involved with horses (Figure 7).
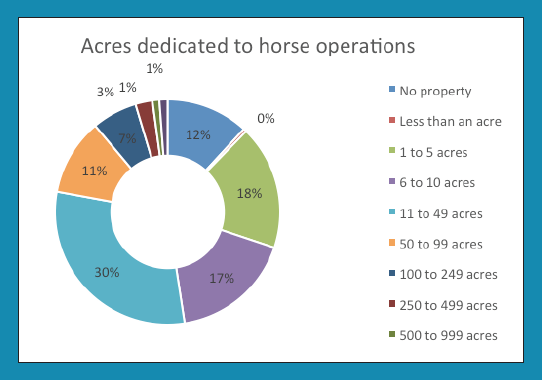
Land Use
More than a third of respondents housed their horses on 10 acres or less. Almost a third had 11 to 49 acres dedicated to their horses (Figure 8). Twenty-two percent had at least 50 acres, and 12 percent did not have land for their horses. Almost 30 percent of respondents valued the land used in their horse operation between $100,000 and $250,000.

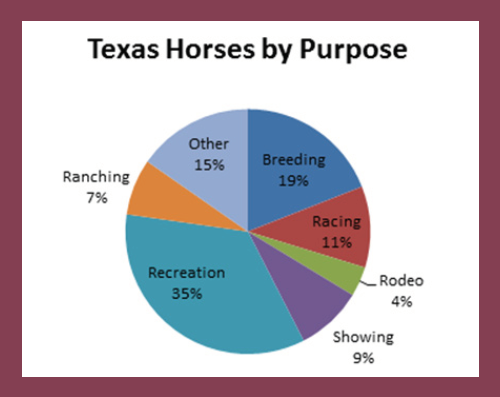
Horse Use
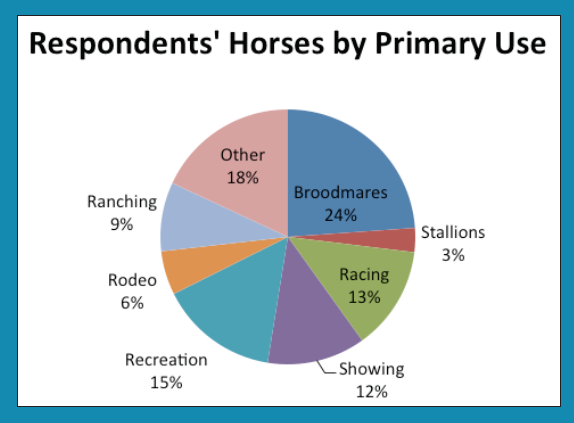

Respondents differed somewhat from the expected general population regarding primary use of their animals (Figure 1 and Figure 2). Data were reweighted using survey data and information from the Deloitte study to extrapolate expected use/purpose across the entire population to estimate revenues and economic impacts.
40.3% of respondents with a farm or ranch reported using horses on their farm/ranch operation.

Horse Economic Impact

Table 2 reports Texas revenues by business category for relevant business types. Other businesses, including training, boarding, and education were deemed to be expenses for both other businesses and recreational riders. Thus, including their revenues in the study would result in double counting economic impacts.

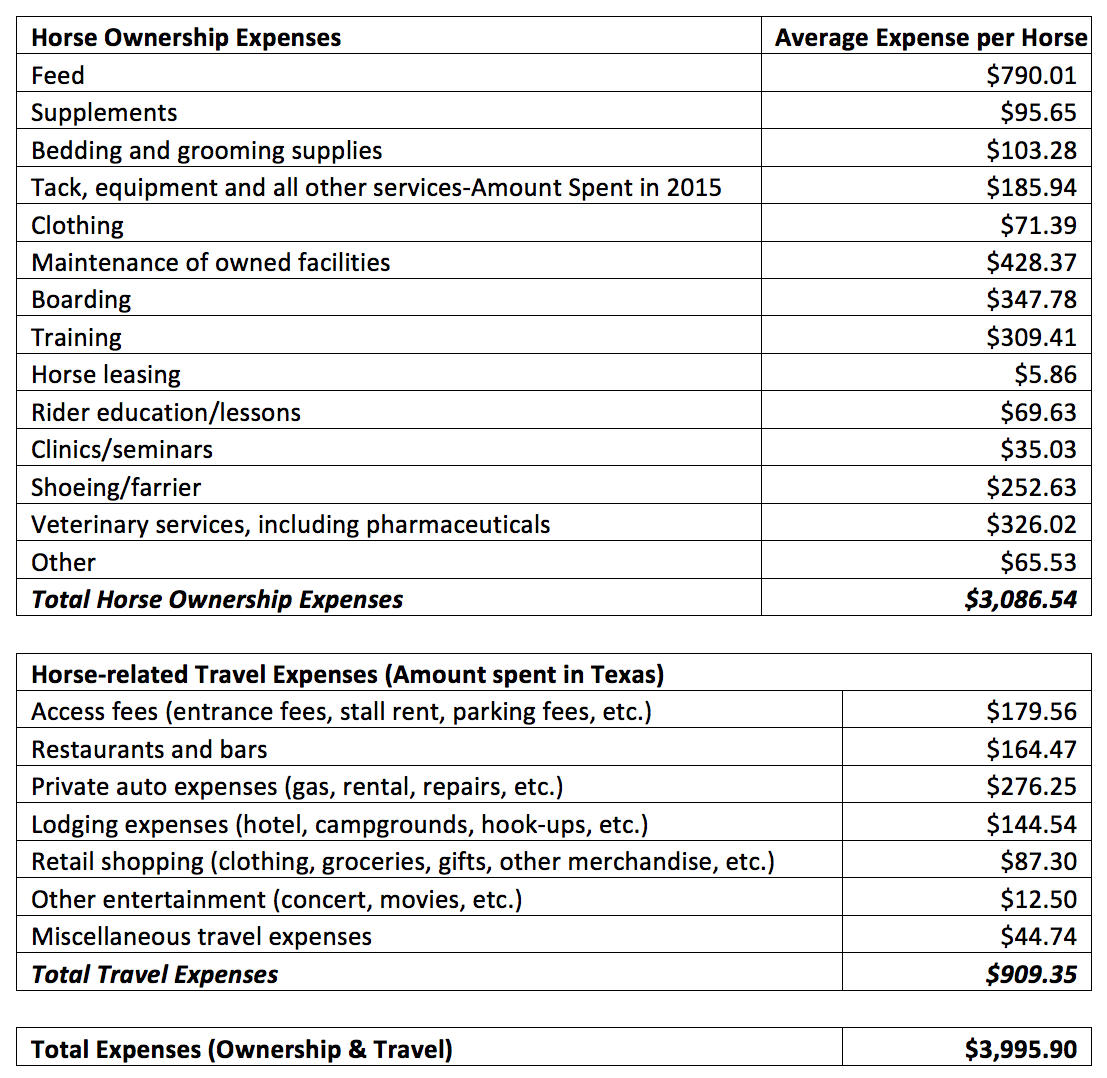
The economic impacts of individuals who own horses for non-business purposes are difficult to measure. Individuals’ horse-related expenditures were surveyed to determine economic impact. Ownership and travel-related expenses are reported separately in Table 3 (right). Among all non-business horses owned for recreation and other purposes, these expenses totaled $1.9 billion.

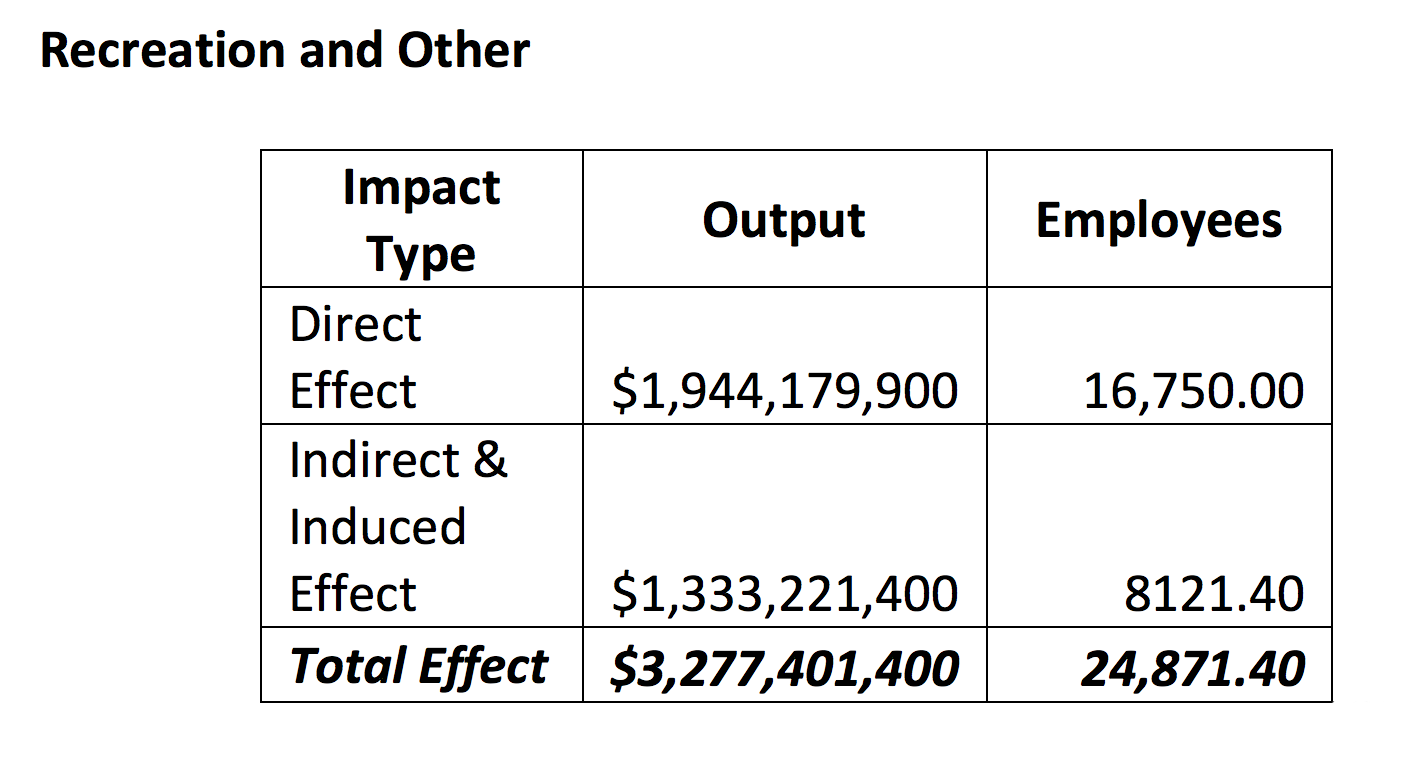
Table 4 reports economic contributions of the horse industry by category. Direct Effect includes individuals’ horse-related expenditures and equine business revenues. This direct spending is multiplied as money circulates through the economy. Indirect & Induced Effect reflects the multiplied effect as businesses purchase along their supply chains, as well as the household expenditures of employees of both horse-related businesses and all indirectly affected businesses. Total Effect is the sum of direct, indirect and induced effects.

Output measures overall economic activity or gross sales. Output includes Value Added, which measures the return to local resources or the contribution to GDP, and Labor Income, which reflects the effects of wages and profits on the incomes of households in the region. Employees reflects a job count and does not distinguish between full-time and part-time workers.
In this case, the original $3.5 billion economic contribution of the Texas equine industry leads to a total statewide economic output of $5.9 billion, including a $3.3 billion contribution to the state’s gross domestic product (GDP) and $2.1 billion in labor income, as well as 52,000 full- and part-time jobs.

Economic contribution of the horse industry by category:
Economic Impact and Analysis
The direct value of industry sales or employment is an important measure of an industry’s strength. However, an industry’s sales or employment figures alone fail to capture the full economic contribution of an industry or an event. When a business makes a sale to a final consumer, a portion of production expenses are paid to the business’ local suppliers and wages are paid to employees. Business owners and employees also spend part of their profits and wages in the local economy—eating at local restaurants and buying groceries, clothing and movie tickets. As money circulates through the local economy, it multiplies the original direct expenditure to a larger total economic output.

Economic impact analysis (or economic contribution analysis) is based on the idea that a dollar spent in a region stimulates additional economic activity, or multiplies as it circulates through the economy. This multiplier effect recognizes that the total effect on output, employment, personal income, and government revenue in the region is greater than the initial dollar spent. For example, a tourist’s expenditure at a souvenir shop contributes not only to that business, but to its suppliers, its suppliers’ suppliers, each of their employees’ incomes, and tax revenues. Of course, some of the original expenditure leaks out of the regional economy. For example, as inventory is imported from other regions, employees commute from other regions, and businesses and households pay state and federal taxes. The portion of the money that remains in the local economy throughout these transactions constitutes the net economic gain. Larger regions contain more economic linkages, which is why large cities and multi-county regions generally have larger multipliers than do small towns or single counties.
Multipliers are calculated based on the purchasing patterns of industries and institutions in the regional economy. Each industry and region combination has a unique spending pattern and a unique multiplier. Multipliers include three components. The direct effect on the economy is the initial economic activity measured—for example, the tourist’s expenditure at the gift shop or total annual cotton crop losses due to a severe drought. The direct effect results in two types of secondary effects. The indirect effect results from the purchase of inputs among local industries. The induced effect results from the expenditure of institutions such as households and governments benefiting from increased activity among local businesses.
Four types of multiplier effects are generally reported in impact analyses. Output or sales multipliers measure the effect of direct spending (or loss) on overall economic activity in the region. The output multiplier provides the largest economic impact value, and therefore is reported in many studies; however, the output multiplier says nothing about how the event affects the welfare of households or the profitability of businesses.
The value-added multiplier is a more appropriate measure of regional welfare. The value-added multiplier measures the event’s contribution to regional gross domestic product (GDP). It is the value added to the regional economy or the return to local resources used in the production of the event.
The labor income or personal income multiplier measures the effect of the event on the incomes of households in the region, and is appropriate for discerning the benefit of an event to a region’s residents. Labor income is a component of value added, which is part of output, so these figures cannot be summed.
The employment multiplier measures the effect of the event on regional employment. Calculation of the employment multiplier assumes that existing employees are fully occupied and does not distinguish between full-time and part-time workers.
Study information and Links

Study partners:
Texas Department of Agriculture
Texas A&M AgriLife Research
Additional information regarding the study, including complete survey results and information regarding the science of economic impact analysis, can be obtained by contacting the Texas A&M Equine Initiative offices.